Table of Contents
The Dashboard View provides quick, convenient access to many commonly used functions. The dashboard can be a launching point for other views in DFexplore. It can also be customized to include the output of commonly used reports.
The default Dashboard View includes:
shortcuts for many commonly used menu items,
tabular and graphical summary of the database status,
tabular summary of the metadata queries, and
study help.

The default Dashboard View can be easily customized by clicking the customize button.
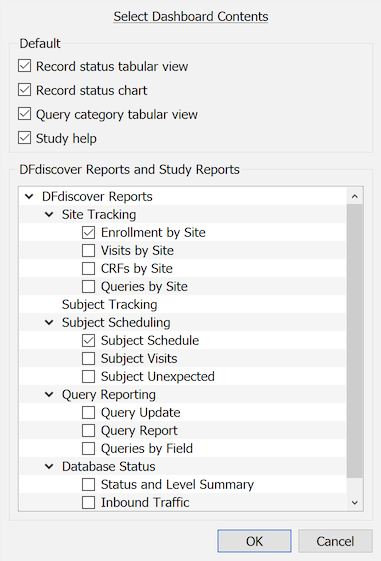
In the customize dialog, select the contents to be included in the Dashboard View. The default dashboard contents appear at the top of the dialog - de-selecting any item removes it from the Dashboard View. Any permitted DFdiscover or study report is also displayed and may be selected for inclusion in the Dashboard View. Reports which are not permitted, or require additional user input before running, are automatically excluded from the displayed list.
Any customizations to the dashboard contents are saved to the local user settings so that they are reflected in subsequent logins.
To further filter the contents of the Dashboard View by individual site or list of sites, specify a subset of permitted sites and click .
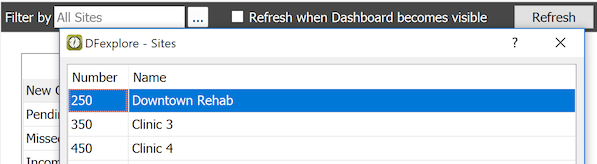
A further checkbox control, Refresh when Dashboard becomes visible, can be enabled to ensure that the contents of the Dashboard View are always up-to-date when switching back to the Dashboard View. For large studies, this refresh action may take a considerable amount of time, in which case it is more efficient to leave this disabled and refresh manually, only when the user clicks .
A vertical column of shortcuts for commonly used menu items is presented on the left side of the dashboard view. The specific shortcuts that appear are filtered by your database permissions - your shortcuts may not match those of other users.
The shortcut for Data View Tasks is a pull-right menu of menu items. The included menu items are the same as the tasks that are presented when you are in Data View and access > .
By default, the dashboard status summary includes all of your permitted study sites. To filter the summary to include specific sites, enter one or more numeric site IDs, or click to access the Sites picker dialog. With both methods, remember to click to update the tables and the graphs.
The table cells and chart legends are clickable. Double-clicking any item builds a task to retrieve those filtered data records and presents them in Data View. Task options can be modified in the confirmation dialog before switching to Data View. If the table cell or chart legend item is related to a query, the Queries View is presented; if it is related to a reason, the Reasons View is presented.
In the table of query categories and statuses, rows are categories and statuses are columns. By default, categories (and hence rows) that have counts greater than 0 are displayed. To display all table rows, check All in the table header for the Query Category column.
To select queries for a specific category and status, double-click the matching cell in the table. To select queries for a specific category and all statuses, double-click the category label in the first column of the matching row. In the task confirmation dialog, you can choose if the task records are displayed in Data View or Queries View.