Table of Contents
This chapter provides a brief introduction to DFexplore. It begins with a description of how to login to a DFdiscover study server, and then describes each of the major components in the application.
To work in a study database you must first start DFexplore and login to the DFdiscover server where the study data and configuration information are stored. This requires an internet connection. The study coordinating site will have provided you with:
-
the DFexplore application (Windows 10, macOS v10.13 or later and Linux versions are available),
-
the name of the DFdiscover server,
-
your username,
-
your initial password, and
-
the name of the study (or studies) for which you have permission to access on the DFdiscover server.
The login process involves authenticating to the DFdiscover server and then selecting the study with which to work.
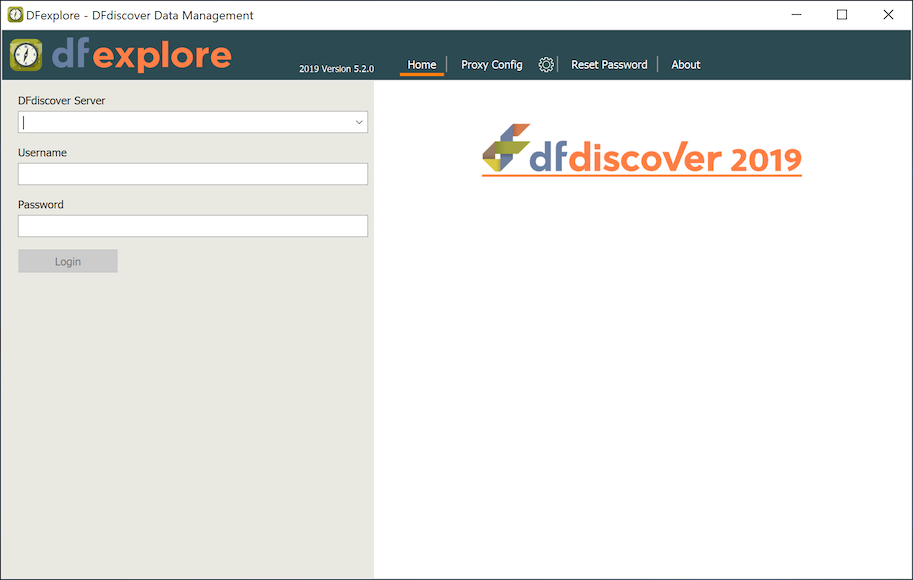
The initial login dialog has the following appearance. The left-side panel shows 3 input fields for DFdiscover Server, your Username and your Password. The right-side panel shows the software logo and version. The contents of this panel can also be customized by the system administrator. A ribbon of clickable options stretches across the top of both panels.
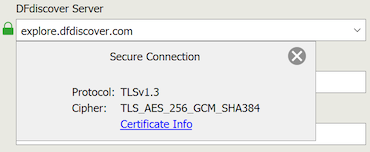
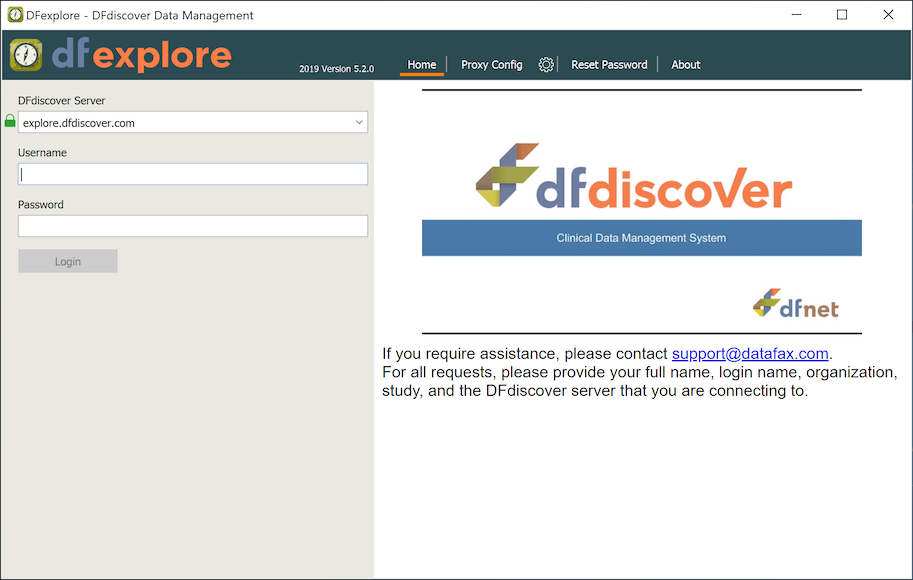
In the left-side panel, enter the value for the DFdiscover Server. If the system administrator has defined a customized login screen, the contents of the right-side panel refresh to show this screen. A green lock icon also appears next to the DFdiscover Server field. The icon is confirmation that a secure connection with the server has been established. Optionally, click the icon and review the details of the connection.
Enter your Username and Password.
Notice that your password is obscured as you type it.
This is a standard security practice to ensure that anyone
else looking at your screen cannot see the entered password.
If Caps Lock is enabled on the keyboard,
the message Caps Lock is On appears as a
tooltip as the password is typed. It does not appear
for any other field in the application.
If your IT department has installed a proxy server
(to filter requests sent to other servers on the internet),
click the proxy server configuration button
(  ) to access the
Configure Proxy Server dialog.
You will need the specific configuration values from your IT
department.
) to access the
Configure Proxy Server dialog.
You will need the specific configuration values from your IT
department.
Click .
DFexplore remembers the most recent servers (and proxy servers) you have specified, so you will only need to enter this information once, but your username and password need to be entered each time you login.
The first time you connect to a DFdiscover server you are prompted to change your password. All data entered and modified is recorded under each user's username. Be vigilant to protect your username and password.
If you forget your password, you can reset it to a single-use temporary password from the login dialog. The new password is emailed to you provided that: this service is allowed on the server, and there is a matching email address registered on the server.
DFexplore includes password aging, an FDA regulatory requirement. After the expiry period has elapsed, you are prompted to reset your password the next time you login.
If login is successful the study selection dialog is presented, with a list of studies you have permission to access on the DFdiscover server. Each study is identified by a unique number, name and current status (available or offline).
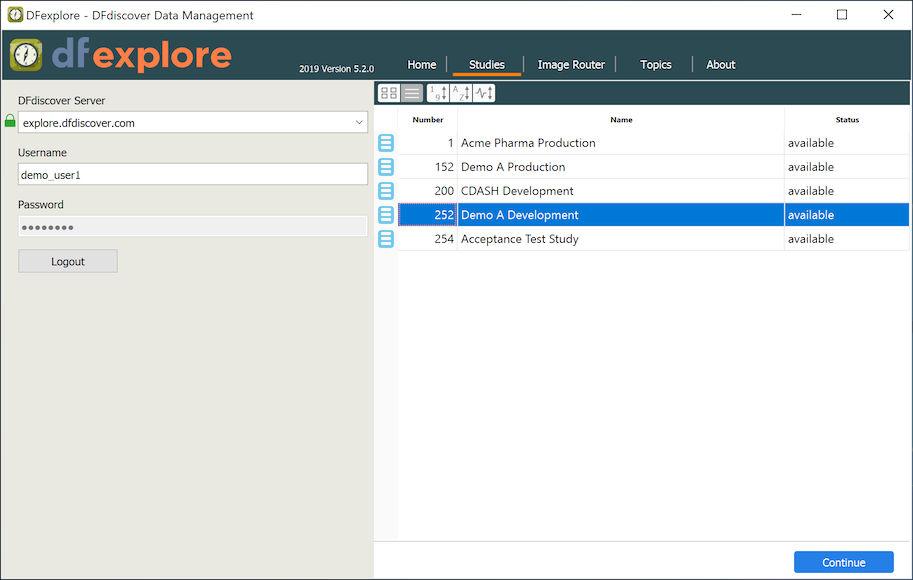
To work on a study, double-click the study name, or highlight it and click .
![[Note]](../../imagedata/note.png) | Note |
|---|---|
Your permissions may be such that you have access to exactly one study and
you do not have access to
|

The user guide is available after successful login: click
 in the study selection dialog,
or select > from the application menu after selecting a
study.
in the study selection dialog,
or select > from the application menu after selecting a
study.
After login and study selection, the main window of DFexplore is presented. You have access to only those subject records and application features that the study administrators have granted you permission to use.
Typically each participating clinical site has access to their own subjects, a subset of the available reports, possibly restrictions on which study forms can be seen, modified, printed and exported, and on which views are available.
The DFexplore views include:
Dashboard - show basic study metrics graphically as well as a menu of operations for commonly performed tasks
Image - enter data from new CRF images received by email, fax or from DFsend
Data - enter, modify and review available subject data
Queries - review and respond to questions from the study coordinating site
Reasons - review reasons that were entered to explain particular data values
Reports - run and review study reports
Status - review data, query and reason status by workflow levels
List - review and export data records in tabular and SAS® formats
Schedule - review visit schedule compliance and schedule requirements
Batch Edits - create, modify and run batch edit checks
An overview of the DFexplore views makes up the rest of this tour. For more details see the chapter devoted to each view.
The Dashboard View provides shortcut access for common DFexplore views and a snapshot summary of the current database status. It can also be customized to show other study report information.

-
View Shortcuts. In the left-hand column, shortcuts are provided for commonly accessed functionality and menu items.
-
Status Summary. Presented in tabular and chart forms, the status summary is an overview of the records and metadata in the current database. The table cells and chart legends are interactive and clickable.
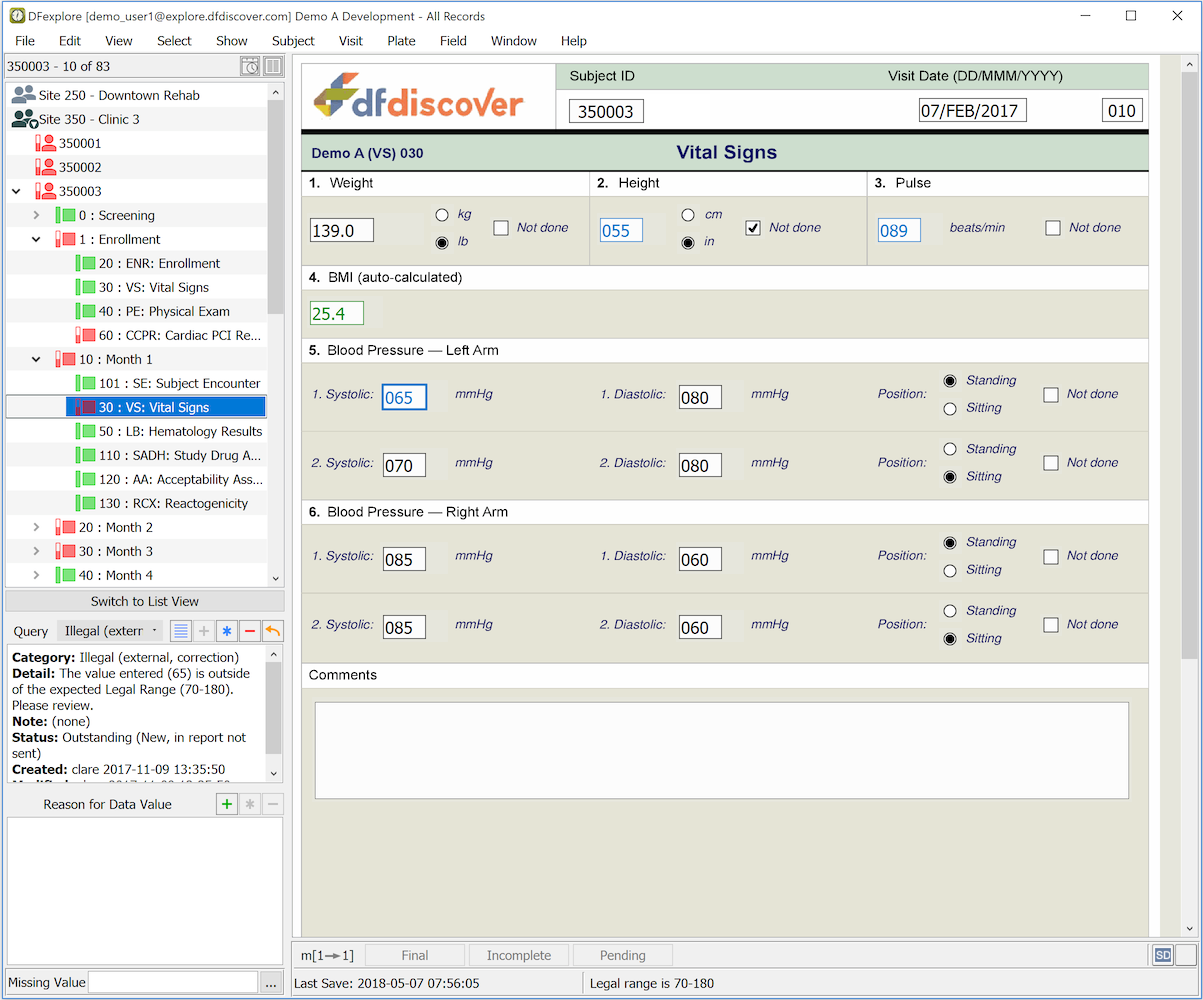
The components of the Data View window include the following:
-
Subject Binders. To enter or review subject data, start by selecting a subject binder from the record list panel on the left side of the main window. Binders are organized and grouped by site and then by subject within site. Each subject binder contains the data forms (CRFs) for an individual subject organized in subsections by study visit. Each subject binder has an icon, followed by a subject ID. In the example above the binder is open for subject ID 350003. You can open only one binder at a time. This locks the subject records giving you exclusive access to the binder until you close it. Subjects, visits and individual pages are color coded as follows:
green - no problems
red - some data problems exist
orange - data entry remains to be completed
-
Data Window. The data window is where you enter data values, filling out the form using a keyboard and mouse instead of pen and paper. Data fields are color coded as follows:
white - legal values
red - illegal, or required but missing, values
blue - outstanding queries, rejected reasons
orange - query replies and reasons pending review
green - query replies and reasons that have been approved
-
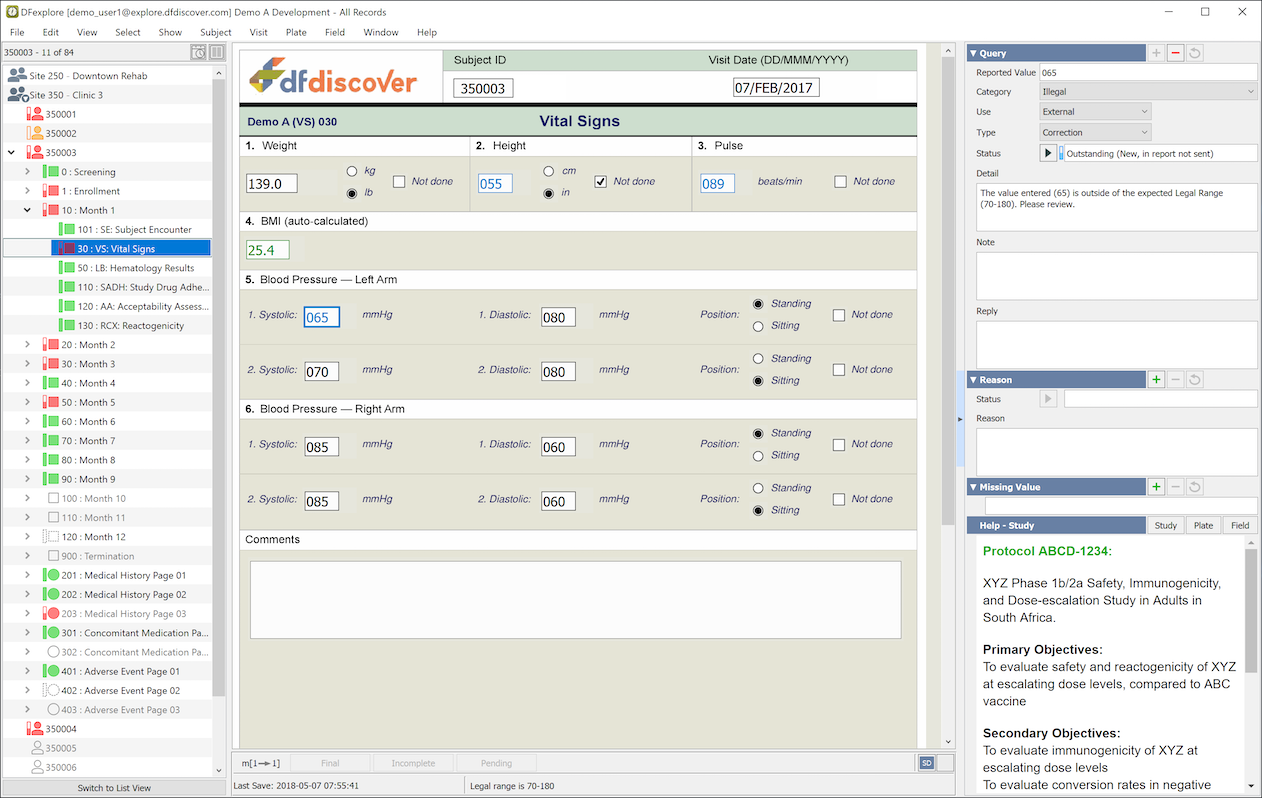
Queries. Data queries can be attached to any data field, either manually or by a programmed edit check. Blue fields have one or more outstanding (unresolved) queries. Queries for the current field appear in the Query panel and the Metadata panel.
In both the Query panel and the Metadata panel it is possible to open a text window where you can answer the query. This turns the data field orange, indicating that the query has been answered and is pending review by the study coordinating site. If the reply is approved, the field is green. If the coordinating site has new questions they will revise the query and the field is again blue.
-
Reasons. You may be able to avoid queries by entering a reason to explain an unusual data value. To add a reason to a data field, select the field in the data window and click the add button (
 )
in the Reason for Data Value panel.
Fields with new reasons are orange to indicate they are pending
review by the study coordinating site. If a reason is approved the field
is green. If the coordinating site has questions they add a
new query to the field and it appears in blue.
)
in the Reason for Data Value panel.
Fields with new reasons are orange to indicate they are pending
review by the study coordinating site. If a reason is approved the field
is green. If the coordinating site has questions they add a
new query to the field and it appears in blue.
-
Missing Values. Some studies use standard missing values, e.g. NA - not available, ND - not done, etc. which can be applied to data fields when a data value can not be entered. Each missing value has a code and a label. If standard missing values have been defined a code can be selected for the current data field by clicking in the Missing Value panel and choosing one. Fields with missing value codes are green and the label is displayed in the Missing Value panel when the data field becomes current. You are not able to add missing value codes to any field that has been defined as essential by the study coordinating site.
-
Saving Your Work. After making changes to data fields, queries or reasons, you must click one of the Save buttons at the bottom of the data window to commit your changes to the central database. If you are interrupted during data entry and do not want to lose your work, you can save a partially completed page using . If you have completed the page and there are no illegal or missing required values (red), or outstanding queries (blue) you can save your work using . Otherwise you need to choose . When there are unsaved changes, one of the Save buttons is colored as a reminder of the most likely appropriate status.

Data is never stored on your personal computer, and will be lost if you do not commit it using one of the Save buttons. You are warned if there are unsaved changes and you try to move off the current page.
-
Last Save. Each time that the data for a page is saved, a modification timestamp for that data is updated. The timestamp is stored centrally, always using the timezone where the DFdiscover server is located. As a convenience, and only in Data View, the timestamp is converted to and displayed in the local timezone. [2] Before using DFexplore, it is extremely important that the system clock on your local computer be accurate for clock time and time zone. Data changes are always recorded using the clock and timezone of the server but your interpretation may be incorrect if the local computer clock is wrong.
-
Message Panel. The message panel is located below the Save buttons and to the right of the Last Save timestamp. The panel displays field level help messages.
-
Images. DFexplore can store images and other supporting documents as well as data. This might include a faxed or scanned copy of a paper CRF or a medical record, DICOM video or test result. If images have been attached to the current page, the image icon (
 )
appears in the bottom-right corner of the screen
(the number and HD setting might vary according to
different settings on different servers).
Depending on your user preference settings (User Settings)
you may need to click the image icon to toggle between data and
image views.
If multiple images exist, the number of images appears in a
neighboring icon.
Clicking this icon launches a separate window where you can
review all of the images.
)
appears in the bottom-right corner of the screen
(the number and HD setting might vary according to
different settings on different servers).
Depending on your user preference settings (User Settings)
you may need to click the image icon to toggle between data and
image views.
If multiple images exist, the number of images appears in a
neighboring icon.
Clicking this icon launches a separate window where you can
review all of the images.
-
Metadata Panel. The metadata panel is an alternative presentation of queries, reasons, missing value and help content for the current data field. It uses the entire vertical height of the main window, potentially allowing more content to be displayed. User interaction with the metadata panel is the same as it is for the individual panels. Use of one panel over the other is purely a user preference.
-
Menubar. The menus, and menu items, in the menubar differ by view and are described in the chapter devoted to each view.
-
User Preferences. You can customize some aspects of DFexplore's behavior using the Preferences dialog. Once set, preferences are preserved across login sessions for the same username on the same computer.
-
Auto Logout. To meet regulatory and subject confidentiality requirements, DFexplore was designed with an auto logout feature that closes the study connection for the current username, after a specified period of inactivity. Inactivity is measured by elapsed time during which there is no keyboard or mouse input. If this occurs when you have unsaved changes in the current data window, the unsaved changes are lost, and you will be warned that this occurred the next time you login to the study. In that event you are asked if you would like to return to the page you were on when the auto logout occurred. This simplifies the task of returning to the page but any unsaved changes cannot be recovered and will require re-entry.
Any keyboard input or mouse movement inside the DFexplore window resets the timer and auto logout. A default and maximum time have been configured by the study coordinating site. In the preferences dialog, you can set a different auto logout interval, but it cannot be a value exceeding the configured maximum time.
The Queries View lists data queries.
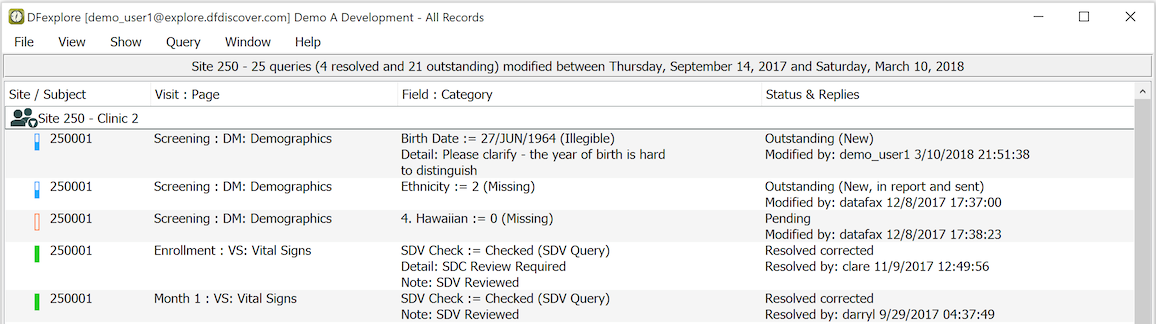
You can filter the list of queries in various ways to find the ones you are interested in. For example by selecting > you can list just those queries that need to be answered. Double-clicking a query opens the Data View to the relevant page and puts input focus on the data field with the query.
The Reasons View lists any reasons that have been entered to explain particular data fields.
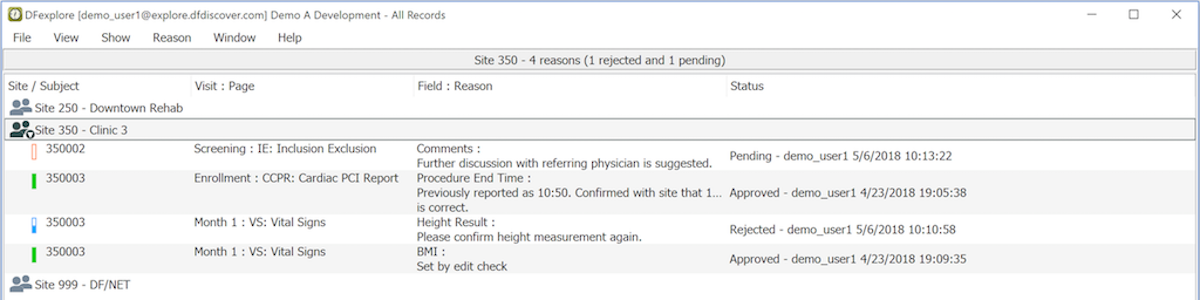
You can filter the list of reasons by status: outstanding, approved and rejected, and search for reasons with specified text strings. Double-clicking a reason opens the data view to the relevant page and puts focus on the data field with the reason.
The Image View is used to enter new data records from paper case report forms (CRFs) that have been faxed or emailed to the DFdiscover study server.
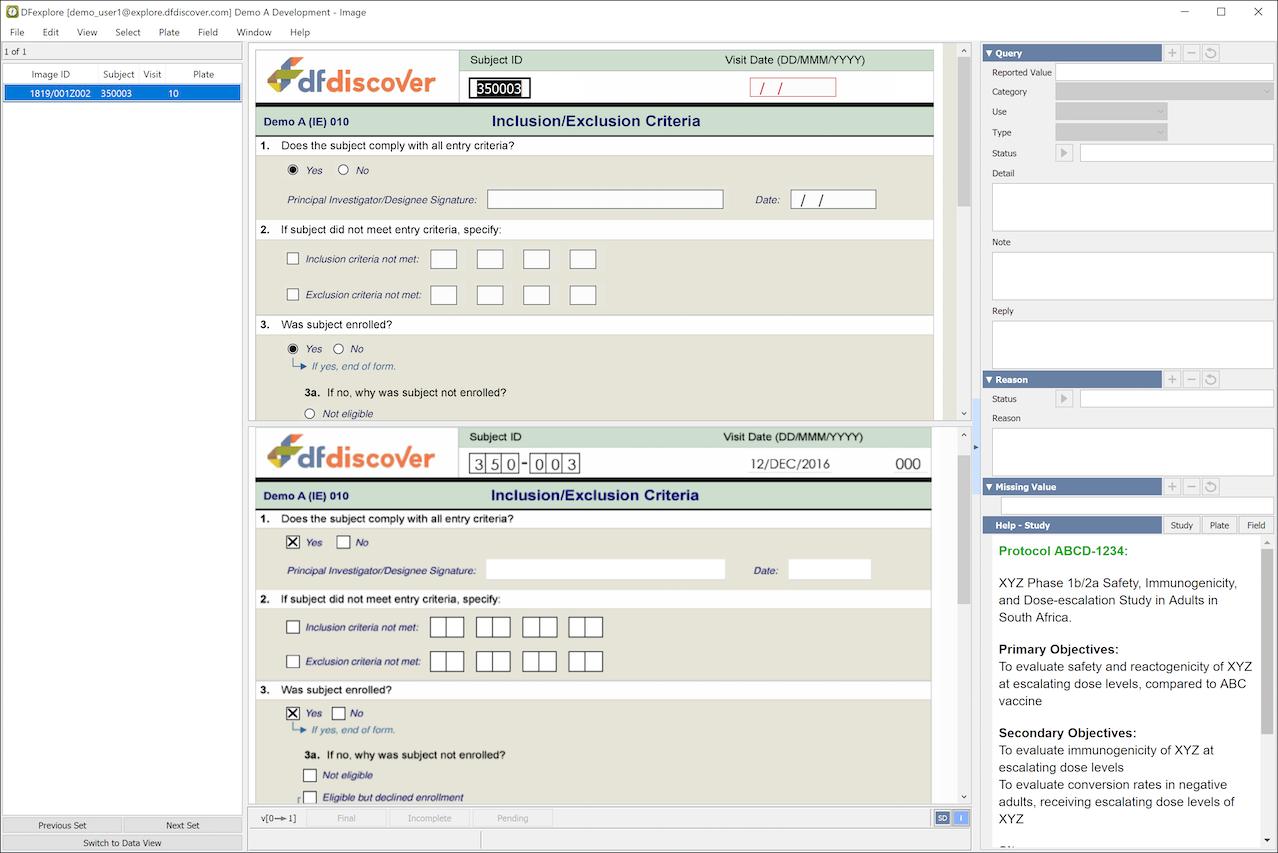
Image View is identical to the Data view except that the list of subject binders is replaced by a list of received pages that need to be entered. Image View features include:
-
Record Selection Options. Typically users chose to enter one document at a time and request the oldest ones first, but it is possible to request only certain CRF forms and to work backwards from newest to oldest arrivals. These options are specified by selecting Manual Retrieval... and completing the dialog.
-
Intelligent Character Recognition. When a CRF page arrives it is immediately scanned and read by the ICR software, preparing an inital data record for review. The task of the person using Image View is to correct any ICR errors or omissions, enter string/textual data and to add any missing value codes, reasons or queries that may be required.
-
Get of New Records. When you are finished with the current set of records, click to release the current set of records and fetch the next set, using the selection method and criteria as previously specified.
-
. Clicking opens the current subject binder in Data View while keeping the focus on the current page to show where it belongs in the binder. You can check other data records as needed before switching back to Image View to complete data entry for the new page.
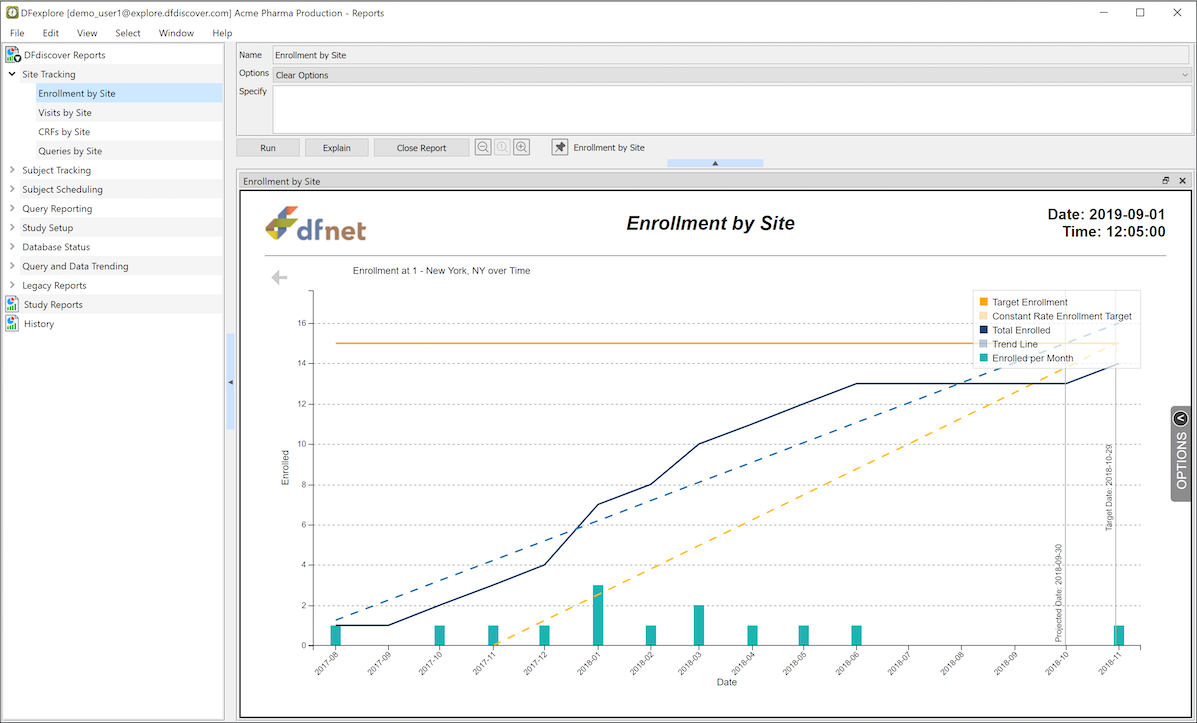
The Reports View is used to run DFdiscover standard and study specific reports.
-
DFdiscover Reports. DFdiscover includes a number of standard reports that can be used in any study. The list of reports (which you have permission to run) appear under the DFdiscover Reports tab in the reports list.
-
Study Reports. Any study specific reports created by the study coordinating site are listed under the Study Reports tab.
-
History. Reports that you have already run during the current login session are saved and are listed under the History tab. Selecting a report from the history list displays the previous output for that report.
-
Options. Most reports have a number of options that can be selected and are applied at the time the report is run.
-
Explain. All of the DFdiscover Reports, and most Study Reports, come with a description of what they do and how to use the options. This documentation can be reviewed by selecting a report from the report list, and clicking .
-
Run. To run a report, select it from the report list and click . The output is displayed and added to the history list.
Schedule View uses several tables to display available information regarding the progress of subjects through the study visitmap.
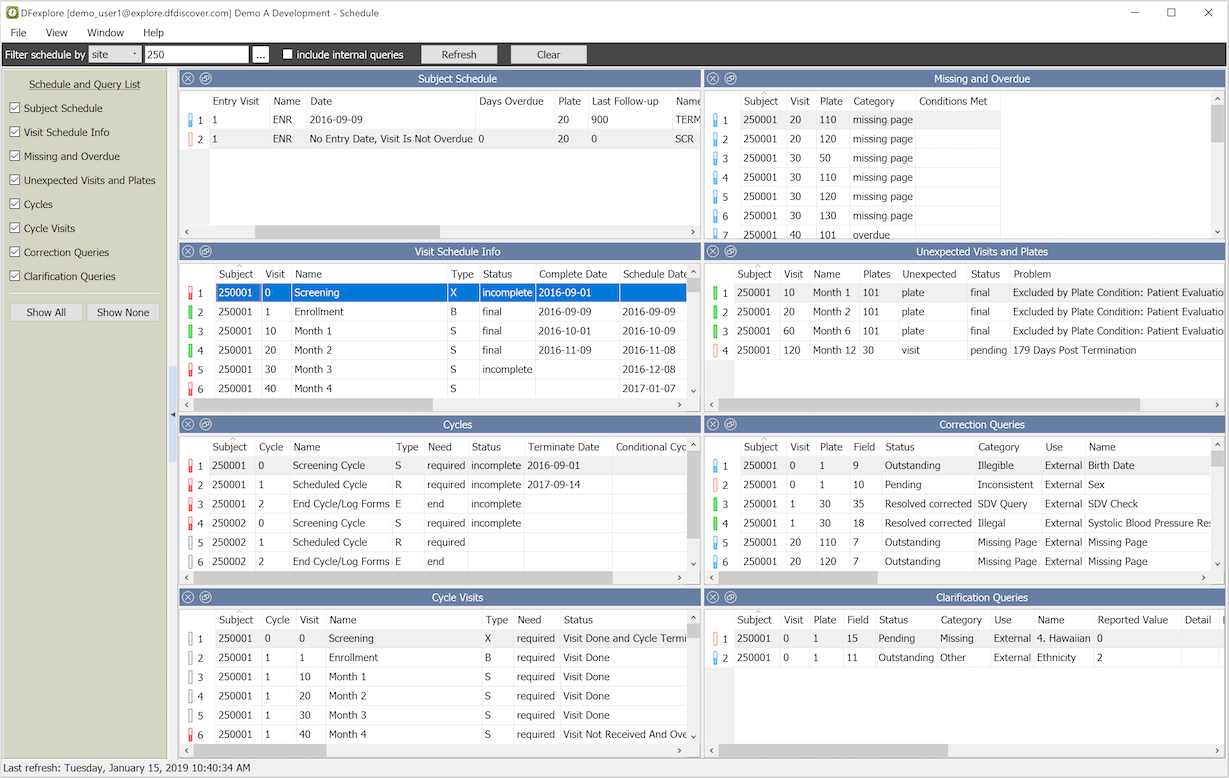
The information displayed in Schedule View depends on user permissions.
Schedule View can be used as a substitute for DF_QCupdate and DF_QCreports, providing information about missing pages, overdue visits and all unresolved, outstanding queries. Double-clicking a row in any table switches to Data View, selecting the matching record in the subject binder.
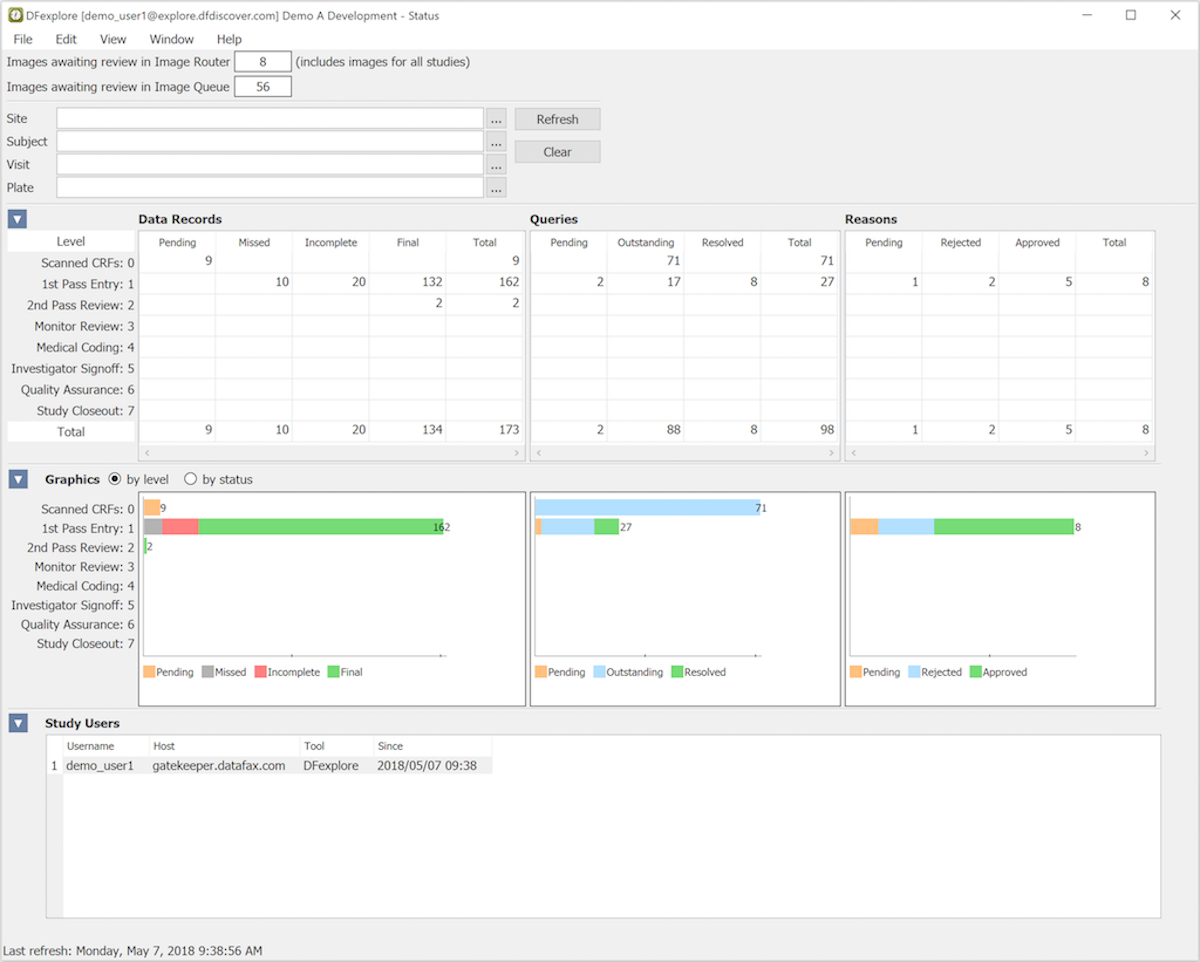
The Status View uses tables and graphs to show the number of data records, queries and reasons in the study database, categorized by workflow level and record status.
-
Permissions. The information displayed in Status View depends on user permissions. Counts include only records that you have permission to see.
-
Filters. The record counts can be displayed for specified sites, subjects, visits and CRF pages by entering the desired values in the filter fields and clicking .
-
Links. You can jump to the data, query or reason records for any cell in the tables by double-clicking the cell.
The List View is used to review all data records for a specified CRF plate in a table, where each column is a data field and each row is a data record.

-
Permissions. A plate or module is selected from the list of study plates in the left panel. Only records that you have permission to view are included, and when a record is selected, only those records which you have permission to view are shown as rows in the table, and columns are hidden for any data fields you are not allowed to see.
-
Selecting Data Fields. Data fields (columns) can be selected and reordered using the > dialog.
-
Selecting Data Records. You can search for data records with specific attributes (e.g. illegal values, outstanding queries, pending reasons, etc.) using the > dialog.
-
Selecting Predefined Views. Some users may have permission to define views, consisting of selected data records and data fields, for others to use. Views are created using > and accessed using 'Select-By View'.
-
Making Changes to Data, Queries and Reasons. You can not modify data values, queries or reasons directly in List view. However double-clicking a data field takes you to that field in Data View where changes can be made (if your permissions allow it). To return to List View from Data View, click .
-
User Preferences. The > dialog includes options for customizing List View including: field color coding, displaying codes vs labels, date formats and column titles.
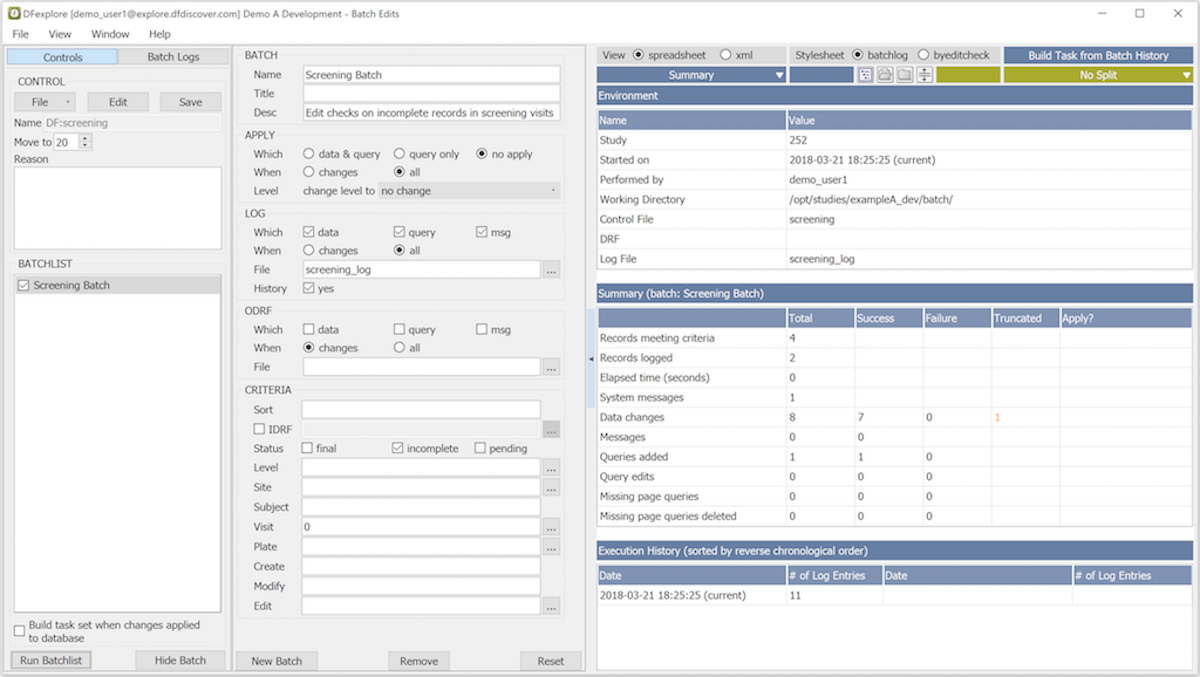
The Batch Edits View provides a way for DFexplore users with permission to create, run and review the output from batch edit checks. This view provides a GUI to the DFbatch facility described in Programmer Guide, Batch Edit checks. Batch programs can be run on the server or locally (on the client's PC), with batch control files and output stored on the server or locally. In both cases, the batch view or the DFbatch application communicate with the DFdiscover server to do their work.
-
Control. Control files can be selected from your local computer or the study server.
-
Batch. The Batch pane is a graphical representation of a selected batch control file. Specification or editing control files in this way follows the same rules as DFbatch control files. This will be familiar to users that use the DFbatch application.
-
Output. Batch output appears in the rightmost panel in Batch Edits View. The output is presented in HTML or XML, the same as the default behavior of the DFbatch application.
[2] This is the only place where an attempt is made to use the local timezone. List View, audit trail reports, SAS® exports, etc. all present server time.