Table of Contents
Reports allow you to view study data and other information in charts, graphs, and tabular listings. The reports available to you are based on your study access details and are determined by the study sponsor or coordinating center.
![[Note]](../../imagedata/note.png) | Note |
|---|---|
| Reports are only available when DFweb is connected to DFdiscover server and API version 5.5 or later. |
Once you have selected a study, view the list of reports available by clicking  Reports in the sidebar on the left of the screen.
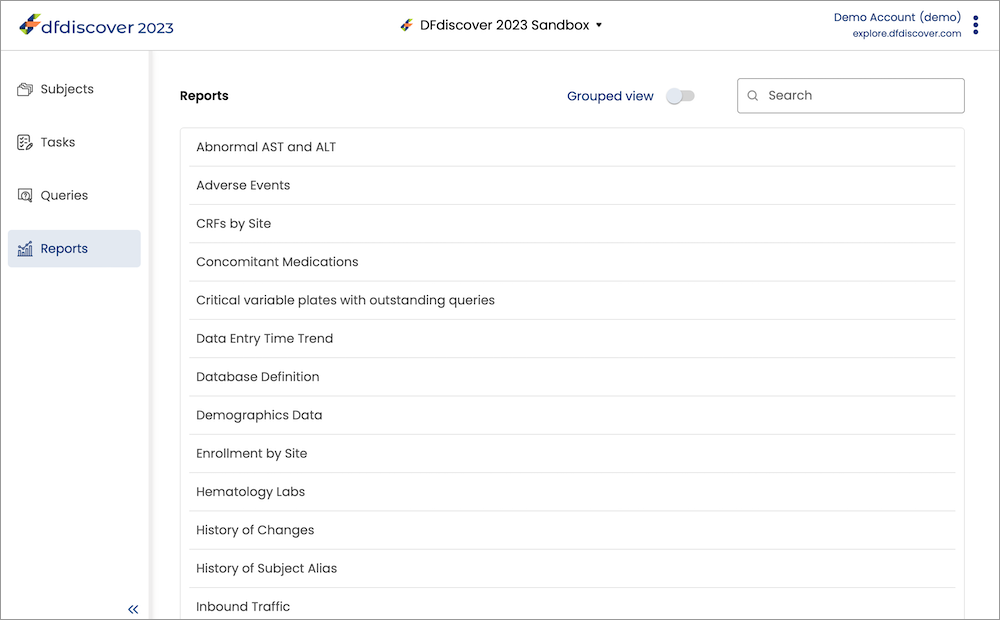
The Reports page provides a list of all reports as well as an option to change how the list of reports is displayed (alphabetically or within groups) and a search option.
By default, reports are listed in alphabetical order. Enable the option (  ) to view the reports within defined groups. With Grouped View enabled, click a group name to open the list of reports available within that group. Click again to close it. To return to the alphabetical list of reports, disable the option (
  ).
).
Use the Search field to filter the list of reports just to those that match your search term.
Click the report name or anywhere in that row to open the report in a dialog.
The reports you see in DFweb depend on your study permissions. This section provides a description of the standard reports available in DFdiscover, however these reports may not all be available to all users.
CRFs by Site. This report shows workflow statistics for time to receive data, enter data, and save data as final. Statistics are grouped by site, or optionally by country. Click on any bar to see the detail view for the site or country. An optional view, Time to Final, is available that presents the percentage of records that have final status on arrival (did not require further editing or clarification) and the percentage of records that have final status now.
Data Entry Time Trend. This report displays the number of data records entered via EDC and from paper CRFs (if applicable), and the number of elapsed days to complete data entry for each record. The numbers are graphed on two axes: Number of Records and Days Elapsed. For time to complete data entry, the number of days between visit date and record creation date (delay) is calculated. If a record does not have a visit date, it is counted in the number of data records but it is not included in the number of days elapsed. Click on any bar to switch to the detail view for the selected site, showing the number of percentage of EDC and paper records and the average elapsed days per month over time. To view the change in data entry over time, check Enable Timeline Animation in the Options drawer. The report window updates to include animation controls and a timeline marked with the earliest date and the most recent date for which data is available. Use the controls to play, pause, and step forward/backward through the data.
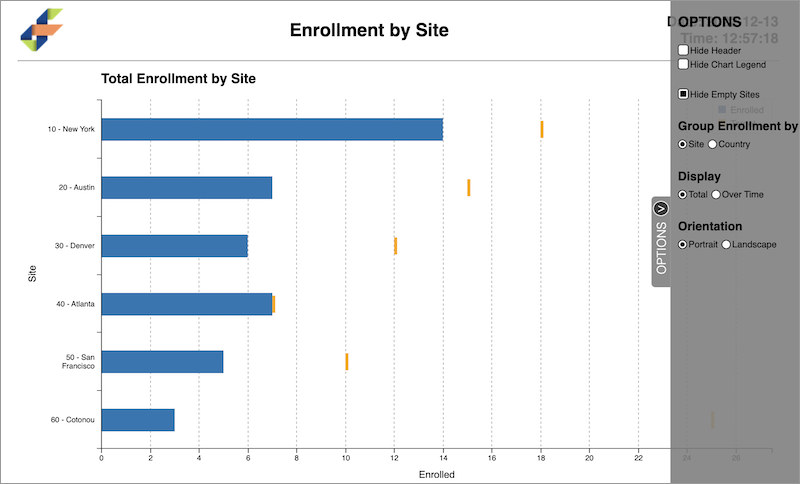
Enrollment by Site. This report displays enrollment numbers on a per site, or per country, basis. The default summary view displays current enrollment for all sites you have access to, including the target enrollment if defined. Click on any bar to see the detail view with aggregated monthly enrollment numbers over time for the selected site or country. In detail view, monthly enrollment data includes the enrollment in that month (bar) and the cumulative enrollment up to and including that month (stepped line). Sloping rate lines are also included: constant rate (which assumes that total enrollment is achieved over the interval between site start and end dates) and trend line (linear interpolation of available monthly data). Vertical markers are included for Target Date (where the constant rate line meets total enrollment), Projected Date (where the trend line meets total enrollment), and optionally Actual Date (where total enrollment was achieved). By default, subjects are considered enrolled if the baseline visit date is entered in the database. This default can be changed via report filters.
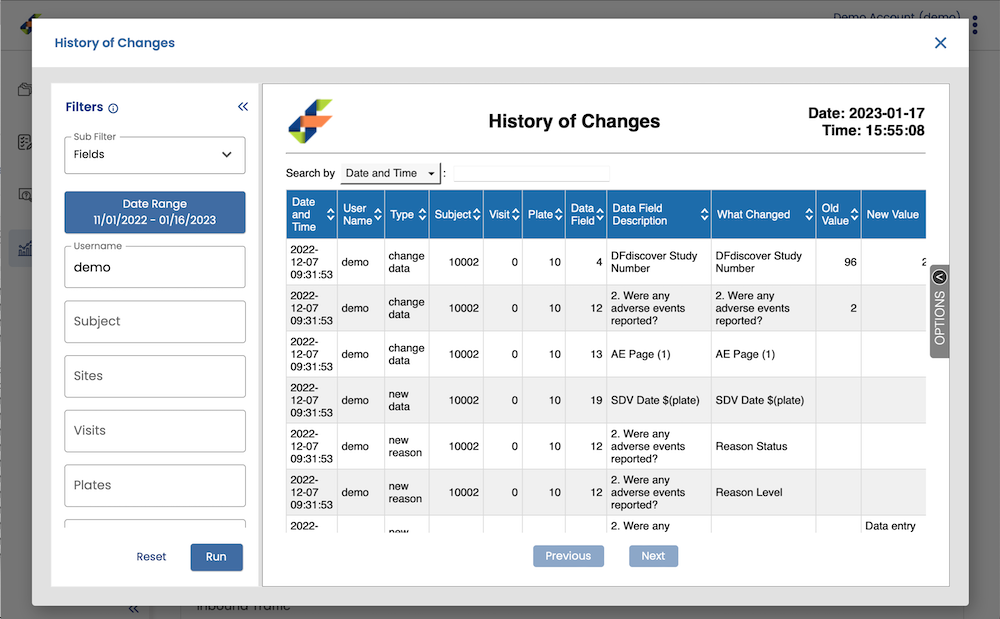
History of Changes. DFdiscover maintains a change history of every data value or metadata value that is added/modified/deleted during the course of the study. This report outputs the change history in tabular format and by default displays the first 100,000 history records (3,000 records per page) for data, queries, and reasons. Filter options are provided to limit the output. The output includes:
identification of when the change the was made (Date and Time), by whom (User Name) and the type of change (Type)
identification of the value that was changed, including the data keys (Subject, Visit, Plate), the data field that was changed (Data Field and Data Field Description)
the actual change (What Changed, Old Value, New Value, Old Code Label, New Code Label)
and the related metadata (Query Usage/Reason Text, Query Category/Reason Code, Status, Level)
Additional sub-filters are provided for different types of output:
List Keys lists database record keys with creation, modification and users who created or modifed the records. Creation and modification timestamps may differ from the record DFcreate and DFmodify fields as they can be imported by DFimport.rpc to keep record's DFcreate and DFmodify values.
Keys Change lists all keys changing history by searching reason pattern 'Keys changed from [id,visit,plate] to [new_id,new_visit,new_plate]'
Image history lists the history of a specific image or a fax containing all pages
Queries by Field. This reports shows the number of queries, of each category, for each field in the database. The output includes each data field that has at least one query. By default, output is sorted by increasing plate number, and field number within plate. Fields which have no queries are not presented. Choosing Sort by Total produces output ordered by the most frequently queried data fields. Note that missing page and overdue visit queries are always attributed to the subject ID field on a plate.
Queries by Site. This report provides summary information about queries in the database. Summary information is reported by site (default) or country and presented in chart and table form. It includes 4 different views: Queries by Status (including resolved and pending queries), Categorical Age of New/Unsent Queries (including outstanding queries not sent to sites in a Query Report), Categorical Age of Sent/Unresolved Queries (including outstanding queries sent to sites in a Query Report), and Percent Resolved Queries.
Query Report. This report provides an overview of the study schedule status and number of queries for each subject, followed by detailed listings of queries, including those that are outstanding, resolved, and pending. Correction queries and clarification queries are included in separate listings.
Query Status Trend. This report shows the current, total number of resolved and outstanding queries per site. To view the percentage of resolved and outstanding queries per site, select the option under Measure in the Options drawer. Click on any bar to switch to the detail view for the selected site, showing the number or percentage of resolved and outstanding queries over time, sampled on a monthly interval based on when the query was created. To view the change in query status over time, check Enable Timeline Animation in the Options drawer. The report window updates to include animation controls and a timeline marked with the earliest date and the most recent date for which data is available. Use the controls to play, pause, and step forward/backward through the data.
Query Time Trend. This report shows the number of resolved and outstanding queries and the days it takes to resolve queries. The numbers are graphed on two axes: Number of Queries and Days Elapsed. To view the percentage of resolved and outstanding queries, select the option under Measure in the Options drawer. For time to resolve queries, the number of days between query creation and query resolution dates is calculated. For outstanding queries, the report uses today as the resolution date to make the calculation. Click on any bar to switch to the detail view for the selected site, showing the number or percentage of resolved and outstanding queries and the average elapsed days over time, sampled on a monthly interval based on when the query was created. To view the change in query resolution over time, check Enable Timeline Animation in the Options drawer. The report window updates to include animation controls and a timeline marked with the earliest date and the most recent date for which data is available. Use the controls to play, pause, and step forward/backward through the data.
Status and Level Summary. This report provides a summary of the workflow levels and status of data records, queries, and reasons in the database. Click on any bar to switch to the detail view of record, query, and reason statuses for that workflow level.
Subject Schedule of Visits. This report provides a summary view of the subject schedule and provides a detail view of the study schedule for each subject. The summary view includes the entry (baseline) visit date, most recent visit date, next expected visit, and days overdue (if the next visit is overdue) or number of outstanding queries. Click any row in the table to view the detail view, which shows all possible study visits and the schedule date (calculated based on visits completed to date), complete date (actual visit dates), days off-schedule or days overdue (if applicable), and the status of the visit.
Task Summary. This report provides a table listing of all tasks available to you, including the name, title, workflow details (mode, level, run edit checks), count of pages currently in the task, and any instructions provided for the task.
Visits by Site. This report shows the number of visits, by visit number, that have occurred at each site. A visit is considered to have occurred if there is at least one page in the database with that visit number.
Additional details on standard DFdiscover reports are available in Standard Reports Guide, Alphabetical Listing, DFdiscover Reports.
Clicking a report name in the reports listing opens that report in a dialog that overlays the main application page.
The report dialog includes:
Report title. The name of the report that is currently open is shown in the top left corner of the dialog.
Filters sidebar. If the report has filters available to customize the report results, the Filters panel will appear on the left side of the dialog. See Filters for more detail.
Report results. The main part of the dialog displays the report results. The top of each report includes the report title in the middle, the logo in the left corner, and the date and time the report was run in the top right corner. Some reports include interactive elements; see Interactivity for more detail.
Close button. Click in the top right corner of the dialog to close it and return to the reports listing.
Some reports have filter options to customize the report results. When a report is opened, the report is displayed using the default options, however the filters can be used to change what data is included in the report.
Click  in the Filters sidebar to view details about each of the available filters for this report. Select or enter filter options as needed, then click to view the updated report based on the updated filter options. Click to restore the filter options to the default.
The Filters sidebar is collapsible, so you can move it out of the way if you don't need it. Click  to collapse and
  to expand as needed.
DFdiscover reports include built-in interactivity - output can be manipulated and displayed in diverse ways without re-executing the report. Some of the interactivity options include:
Options drawer. The options drawer is opened by clicking on the vertical options tab (
 ).
Several appearance settings and behaviors can be changed in the options
drawer.
Each report has a common option to show/hide the header, plus its own
unique settings.
When the drawer is open, the report output is updated
when a setting is changed.
When no further changes are needed, click
).
Several appearance settings and behaviors can be changed in the options
drawer.
Each report has a common option to show/hide the header, plus its own
unique settings.
When the drawer is open, the report output is updated
when a setting is changed.
When no further changes are needed, click  to close the drawer.
Display/hide elements. The visibility of elements in a graph can be toggled by clicking the corresponding element in the graph legend. Clicking an element once turns off visibility and clicking it again turns on visibility.
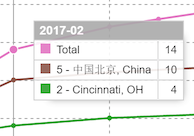
Display graph values. By hovering the mouse pointer over a graph or chart element, it is possible to inspect the data value(s) in that element.
Report sub-views. More info for a report is available by clicking a chart or graph element. In some cases, this action creates a sub-view of the current report, switching the displayed content. From the sub-view, you can return to the main report window by clicking the return arrow (
 ).
).
Search and sort. For reports that include tabular listings, search the output by selecting the field of interest in the Search by dropdown list and then specifying the value to search for. Each column can be sorted in ascending or descending order by clicking the column heading. Each click reverses the previous sort order.