Table of Contents
Queries View allows you to review data queries, with filter options such as query status (outstanding, pending, resolved), query category (such as missing, illegal, overdue visit), and query timing.
![[Note]](../../imagedata/note.png) | Note |
|---|---|
| Query View is only available when DFweb is connected to DFdiscover server and API version 5.5 or later. |
Once you have selected a study, the list of data queries is available by clicking  Queries in the sidebar on the left of the screen.
By default, the outstanding queries from the first site in the site list are shown. If you open a site before clicking queries in the sidebar, the queries for that site will be shown by default. Both the site and status can be changed using the filters.
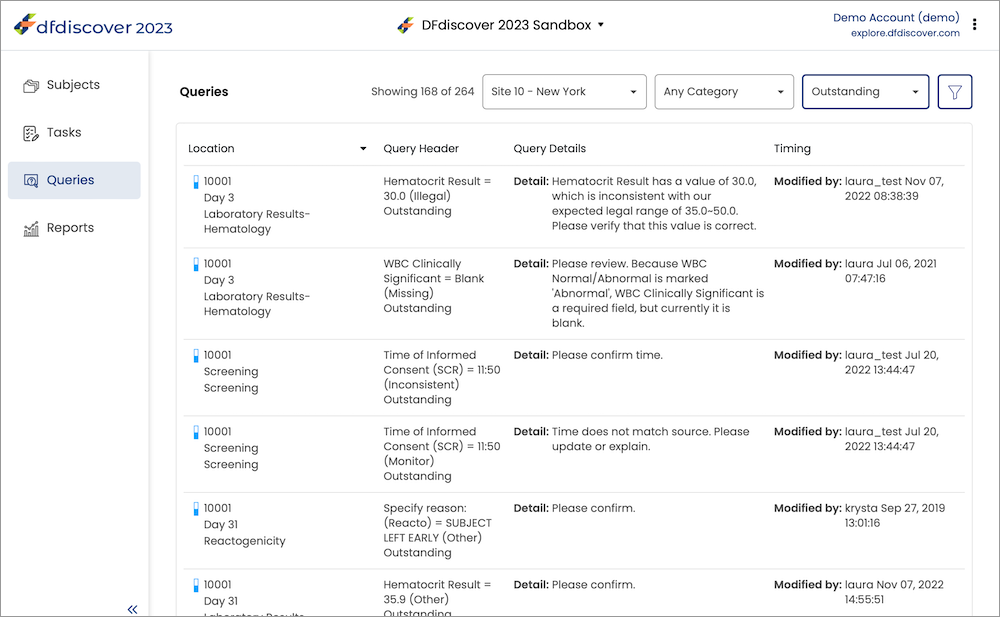
With the query list open, a table of queries with 4 columns is shown. The columns of the table are:
Location. Shows the subject ID, visit label and label of the CRF the query is on. Also shows the status of the query as an icon.
Query Header. Shows the field name, field value, category, and status of the query in the format of "Field name = Field value (Category)" with the status on the next line.
Query Details. Shows the query details, any reply that was given to the query, and any notes added to the query.
Timing. Shows when the query was created and last modified, and by whom it was created and last modified.
In addition to the queries list, the Queries page also includes options to filter queries by site, status, category, and timing. The number of queries matching the filter and the total queries in the site is shown next to the filters.
The site, status and category filters are can be changed quickly using the dropdowns on the query list page. Selecting a value from these will update the table to show only the queries that match the new filter. The status and category filters also have an Any option, which removes the filter and shows queries with any of those options.
Click  to open filter dialog for more filtering options.
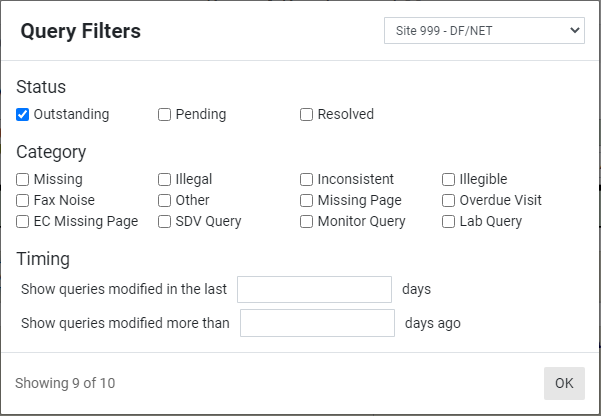
The query filter dialog provides access to the same filters as in the query list page, plus the timing filters. In the dialog, it is possible to select more than one status or category so queries with any of the selected options show. Updates to the site, status, and category filters in the filter dialog also update the dropdowns on the query list page. If more than one option is selected for status or query, then the corresponding dropdown on the query list page will display Multiple Statuses or Multiple Categories.
The timing options allow you to filter by queries modified before or after a certain number of days ago. Adding a value to one of the timing fields will clear the other.
Once you have the desired filters applied, click to return to the query list page.
The query list is sorted based on the subject ID, visit number and CRF number in ascending order by default. This can be reversed to show the highest subject ID, visit and CRF first by clicking the Location column header. In addition, it is possible to sort the queries based on when they were last modified by clicking the Timing header. Clicking again reverses the direction of the timing sort as well.
To review a query, double-click any query to open the CRF and go to the field where the query is located. Click to open the query dialog.
The query binder is opened in the sidebar with the current subject, visit, CRF and query showing. All filters applied to the query list in the query list page are also applied to the query binder. You can review, filter and navigate through the query list using the query binder.
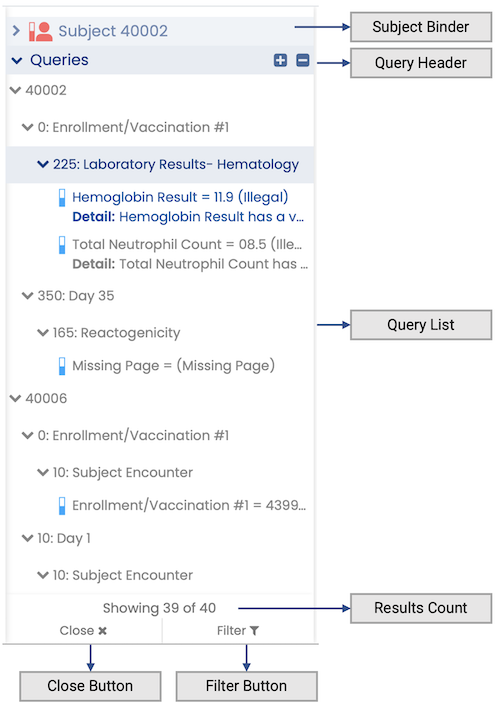
Subject Binder. View all CRFs in the current subject binder by clicking the subject binder header. Clicking again collapses the subject binder and reopens the query binder.
Query Header. Click the query binder header to collapse or expand the query binder. Click to expand all subjects, visits, and CRFs so all queries are shown in the list. Click to collapse them all so all queries are hidden.
Query List. The query list shows the status icon, field name, field value, category, detail and reply of all queries. Click a subject, visit or CRF to expand or collapse it. Click a query to navigate to that CRF and field. Hovering over a query in the query list shows more details about the query.
Results Count. Shows the number of queries that match the filter criteria, and the total queries in the currently selected site.
Close Button. Closes the query binder while staying on the current CRF.
Filter Button. Opens the Query Filter Dialog.
The query binder stays up to date with the data that has been saved. If you make a change to a query, you must save it for the changes to appear in the query binder.
You can expand the subject binder to view all other CRFs in the subject binder for the current subject. You can open CRFs from the subject that don't have queries in the query binder to review their contents and assist you in reviewing a query. Expand the query binder and click the query you were working on to return to the query.
Click in the sidebar to open the filter dialog. The filter dialog behaves the same as when opened from the query list, but it updates the query binder instead. See Query Filter Dialog for more details.