Table of Contents
The Dashboard View provides quick, convenient access to many commonly used functions. The Dashboard View can be a launching point for other views in DFexplore. It can further be customized to include commonly used reports, tabular and graphical summaries of the database status, and study help.
The contents of the Dashboard View are easily customized by clicking the customize button.

In the customize dialog, select the contents to be included in the Dashboard View. The default dashboard contents appear at the top of the dialog - de-selecting any item removes it from the Dashboard View. Any permitted DFdiscover or study report is also displayed and may be selected for inclusion in the Dashboard View. Reports which are not permitted, or require additional user input before running, are automatically excluded from the displayed list.
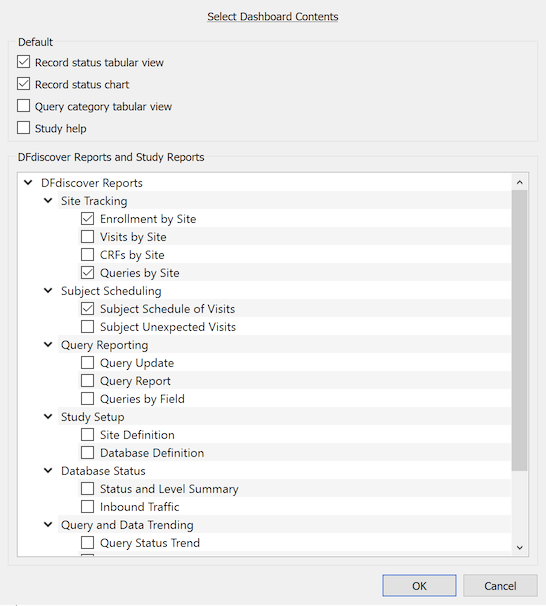
Any report can also be added by "pinning" it from Reports View, Adding Reports to the Dashboard.
Any customizations to the dashboard contents are saved to the local user settings so that they are reflected in subsequent logins.
A vertical column of shortcuts for commonly used menu items is presented on the left side of Dashboard View. The specific shortcuts that appear are filtered by your database permissions - your shortcuts may not match those of other users.
The shortcut for Data View Tasks is a pull-right menu of menu items. The included menu items are the same as the tasks that are presented when you are in Data View and access > .
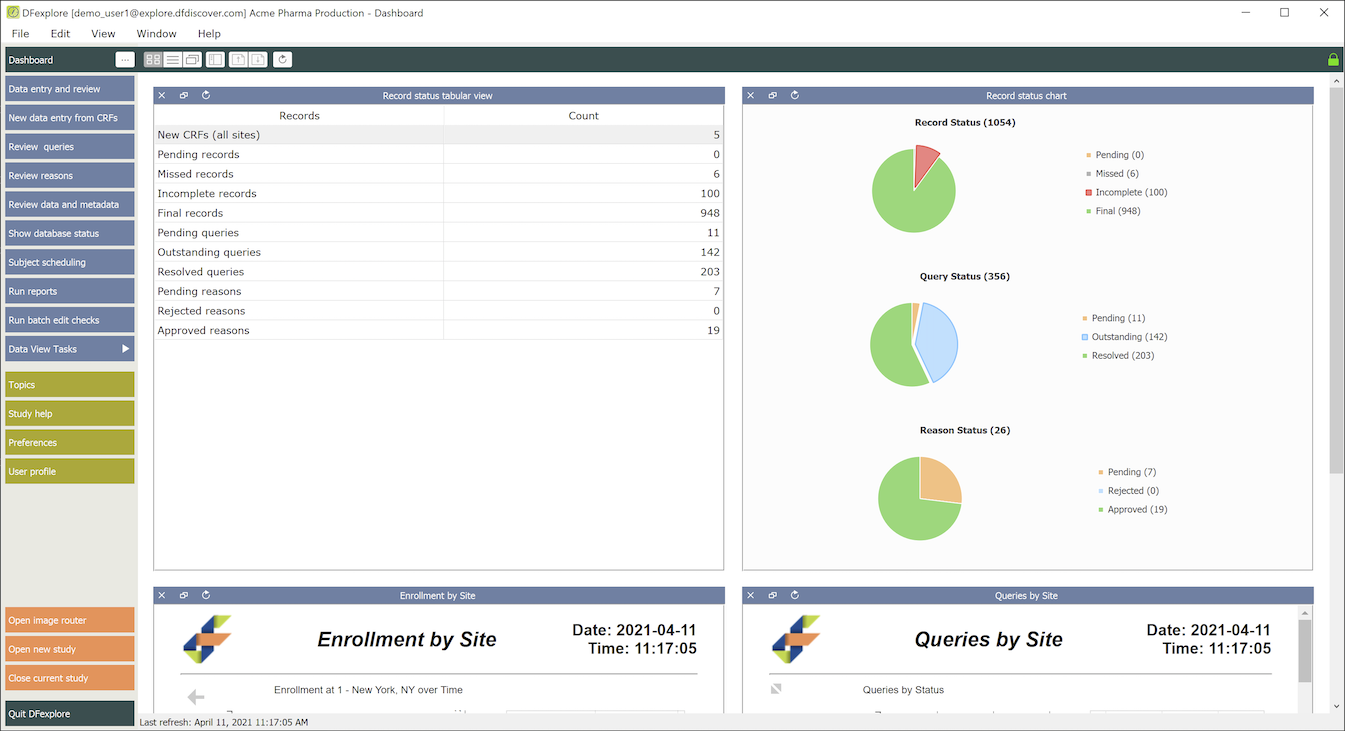
The main Dashboard View contains sub-windows, where each sub-window displays
the output of a specific report. For optimal performance, Dashboard View
limits the maximum number of sub-windows to 25 (just as Reports View does).
[5]
The arrangement and ordering of the sub-windows is controlled by settings in the presentation ribbon.

Specifically the sub-windows can be presented in
 Grid view: Sub-windows
are organized in 2 columns (if there are at least 2 sub-windows) and as many
rows as needed.
Grid view: Sub-windows
are organized in 2 columns (if there are at least 2 sub-windows) and as many
rows as needed.
 List view: Sub-windows
are organized in 1 column with as many rows as needed.
List view: Sub-windows
are organized in 1 column with as many rows as needed.
 Single view: Sub-windows
are stacked so that one sub-window is visible at any time, occupying all of
the available window space. A convenient
thumbnail index and previous/next buttons are included, making it easy to
navigate between single views.
Single view: Sub-windows
are stacked so that one sub-window is visible at any time, occupying all of
the available window space. A convenient
thumbnail index and previous/next buttons are included, making it easy to
navigate between single views.
To update, with current study data,
the contents of all sub-windows, click the Refresh All button
(  ).
Depending upon the complexity and volume of the data request, refreshing
all sub-windows may take several seconds.
).
Depending upon the complexity and volume of the data request, refreshing
all sub-windows may take several seconds.
Each sub-window is a rectangular area with a body and a header. The body contains the report output. The header includes the report title of the window contents, and 3 action buttons. The action buttons, of any sub-window, from left-to-right are: close, undock and refresh the contents.

The header may also be grabbed and dragged to "undock" the window from the Dashboard View. This is similar to undocking windows in Reports View. The undocked window can be moved and positioned independent of Dashboard View. Additionally the undocked window can be "dropped" elsewhere in the sub-windows; this adjusts the layout to fill the space created by the undocked window and also creates a space to insert the undocked window in the new location.
By default, the dashboard includes several special status tables and graphs. These tables and graphs are special because the table cells and chart legends are clickable. Double-clicking any item builds a task to retrieve those filtered data records and presents them in Data View. Task options can be modified in the confirmation dialog before switching to Data View. If the table cell or chart legend item is related to a query, the Queries View is presented; if it is related to a reason, the Reasons View is presented.
In the table of query categories and statuses, rows are categories and statuses are columns. By default, categories (and hence rows) that have counts greater than 0 are displayed. To display all table rows, check All in the table header for the Query Category column.
To select queries for a specific category and status, double-click the matching cell in the table. To select queries for a specific category and all statuses, double-click the category label in the first column of the matching row. In the task confirmation dialog, choose if the task records are displayed in Data View or Queries View.
[5] When there are already 25 sub-windows defined in Dashboard
View attempting to add or pin an additional report will warn the user that
an existing sub-window must be closed first.